Interactive Thematic Maps & Visualizations. #Interactive maps #Demographic maps #Data visualization #Visualizations #Interactive #Maps
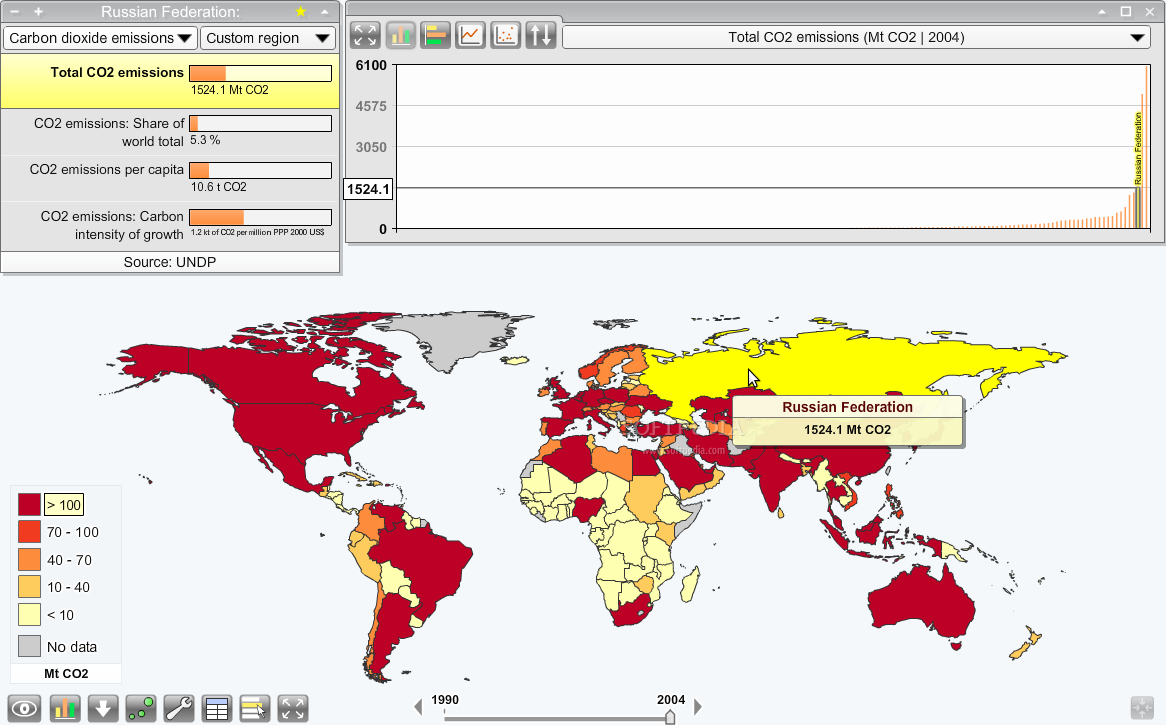
StatPlanet is an advanced interactive data visualization and mapping tool, used by organizations such as UNESCO, SACMEQ and the Global Environmental Facility to better communicate data. This free software can be used to create interactive graphs, charts and thematic maps (choropleth maps, proportional symbol maps and qualitative / descriptive maps).
StatPlanet can also be used as free educational software to learn about the world in subjects such as geography, health, economics and social studies. It includes data on demography & population, economy & development, education, environment & energy, health and gender.
What's new in StatPlanet Map Maker 2.3:
- December:
- Improved & easier map legend customization. Copy/paste map customizations from StatPlanet into the StatPlanet Data Editor;
- Visualization: animated time-series graph; bullet graph option;
- Text labels added automatically for custom maps with drag-and-drop positioning in StatPlanet;
StatPlanet Map Maker 2.3
add to watchlist add to download basket send us an update REPORT- runs on:
- Linux
- filename:
- StatPlanet_Map_Maker.zip
3 screenshots:
- main category:
- Science
- developer:
- visit homepage
ShareX 16.0.1
Capture your screen, create GIFs, and record videos through this versatile solution that includes various other amenities: an OCR scanner, image uploader, URL shortener, and much more

Zoom Client 6.0.3.37634
The official desktop client for Zoom, the popular video conferencing and collaboration tool used by millions of people worldwide

Windows Sandbox Launcher 1.0.0
Set up the Windows Sandbox parameters to your specific requirements, with this dedicated launcher that features advanced parametrization

7-Zip 23.01 / 24.04 Beta
An intuitive application with a very good compression ratio that can help you not only create and extract archives, but also test them for errors

4k Video Downloader 1.5.3.0080 Plus / 4.30.0.5655
Export your favorite YouTube videos and playlists with this intuitive, lightweight program, built to facilitate downloading clips from the popular website

calibre 7.9.0
Effortlessly keep your e-book library thoroughly organized with the help of the numerous features offered by this efficient and capable manager

Context Menu Manager 3.3.3.1
Customize Windows’ original right-click context menu using this free, portable and open-source utility meant to enhance your workflow

Bitdefender Antivirus Free 27.0.35.146
Feather-light and free antivirus solution from renowned developer that keeps the PC protected at all times from malware without requiring user configuration

IrfanView 4.67
With support for a long list of plugins, this minimalistic utility helps you view images, as well as edit and convert them using a built-in batch mode

Microsoft Teams 24060.3102.2733.5911 Home / 1.7.00.7956 Work
Effortlessly chat, collaborate on projects, and transfer files within a business-like environment by employing this Microsoft-vetted application

38% discount
Bitdefender Antivirus Free
- Bitdefender Antivirus Free
- IrfanView
- Microsoft Teams
- ShareX
- Zoom Client
- Windows Sandbox Launcher
- 7-Zip
- 4k Video Downloader
- calibre
- Context Menu Manager
essentials
Click to load comments
This enables Disqus, Inc. to process some of your data. Disqus privacy policy