VisIt is an interactive parallel visualization and graphical analysis tool for viewing scientific data.. #Parallel visualization #Graphical analysis #Scientific data viewer #VisIt #Parallel #Visualization
VisIt is an interactive parallel visualization and graphical analysis tool for viewing scientific data.
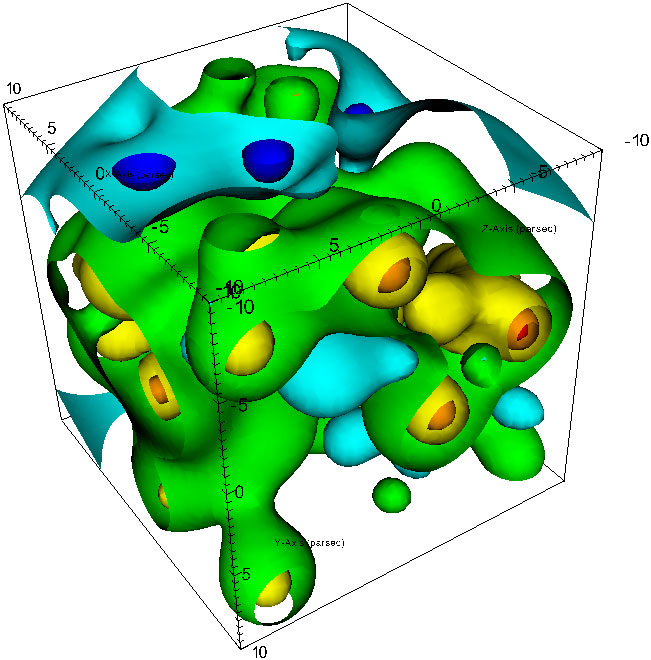
Users can quickly generate visualizations from their data, animate them through time, manipulate them, and save the resulting images for presentations. VisIt contains a rich set of visualization features so that you can view your data in a variety of ways.
It can be used to visualize scalar and vector fields defined on two- and three-dimensional (2D and 3D) structured and unstructured meshes.
It was designed to interactively handle very large data set sizes in the terascale range, and works well down to small data sets in the kilobyte range.
VisIt 2.5.2
add to watchlist add to download basket send us an update REPORT- runs on:
- Linux
- filename:
- visit2_5_2.linux-rhel5.tar.gz
3 screenshots:
- main category:
- Science and Engineering
- developer:
- visit homepage
calibre 7.9.0
Effortlessly keep your e-book library thoroughly organized with the help of the numerous features offered by this efficient and capable manager

IrfanView 4.67
With support for a long list of plugins, this minimalistic utility helps you view images, as well as edit and convert them using a built-in batch mode

7-Zip 23.01 / 24.04 Beta
An intuitive application with a very good compression ratio that can help you not only create and extract archives, but also test them for errors

Bitdefender Antivirus Free 27.0.35.146
Feather-light and free antivirus solution from renowned developer that keeps the PC protected at all times from malware without requiring user configuration

Zoom Client 6.0.0.37205
The official desktop client for Zoom, the popular video conferencing and collaboration tool used by millions of people worldwide

Microsoft Teams 24060.3102.2733.5911 Home / 1.7.00.7956 Work
Effortlessly chat, collaborate on projects, and transfer files within a business-like environment by employing this Microsoft-vetted application

Windows Sandbox Launcher 1.0.0
Set up the Windows Sandbox parameters to your specific requirements, with this dedicated launcher that features advanced parametrization

ShareX 16.0.1
Capture your screen, create GIFs, and record videos through this versatile solution that includes various other amenities: an OCR scanner, image uploader, URL shortener, and much more

paint.net 5.0.13 (5.13.8830.42291)
Packed with an array of options and an intuitive interface, this application enables you to create professional-looking photographs

4k Video Downloader 1.5.3.0080 Plus / 4.30.0.5655
Export your favorite YouTube videos and playlists with this intuitive, lightweight program, built to facilitate downloading clips from the popular website

% discount
ShareX
- ShareX
- paint.net
- 4k Video Downloader
- calibre
- IrfanView
- 7-Zip
- Bitdefender Antivirus Free
- Zoom Client
- Microsoft Teams
- Windows Sandbox Launcher
essentials
User Comments
This enables Disqus, Inc. to process some of your data. Disqus privacy policy