A free application for Scientific Data Analysis and Visualization. #Data analysis #Publication-quality plotting #Data visualization #Analyzer #Visualizer #Plotting
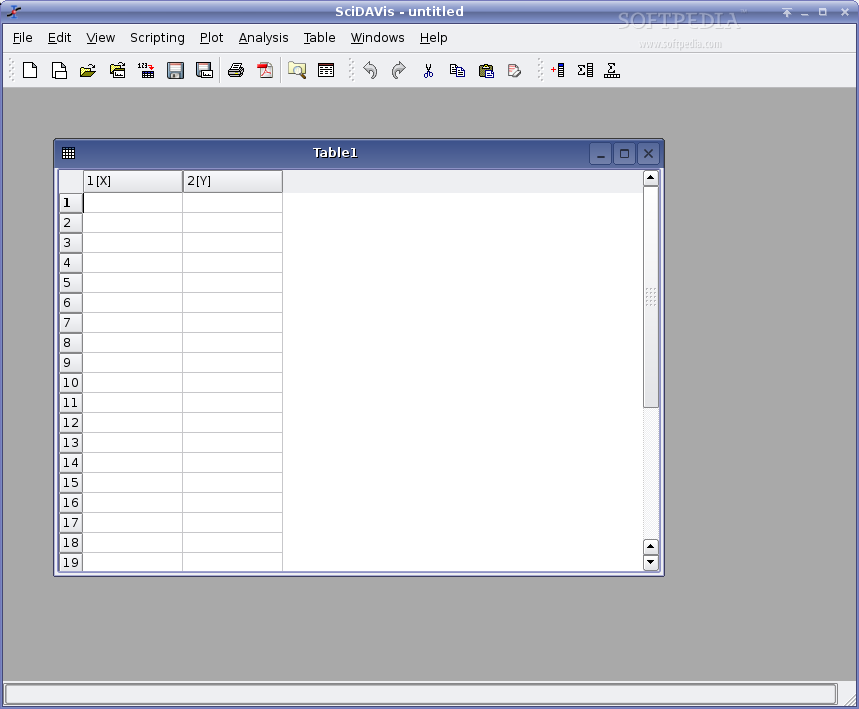
SciDAVis is a free application for Scientific Data Analysis and Visualization. SciDAVis is a free interactive application aimed at data analysis and publication-quality plotting. It combines a shallow learning curve and an intuitive, easy-to-use graphical user interface with powerful features such as scriptability and extensibility.
SciDAVis runs on GNU/Linux, Windows and MacOS X; possibly also on other platforms like *BSD, although this is untested. SciDAVis is similar in its field of application to proprietary Windows applications like Origin and SigmaPlot as well as free applications like QtiPlot, Labplot and Gnuplot.
What's new in SciDAVis 0.2.4:
- some parts of the Python API have been marked as deprecated and generate
- warnings when used. This may be a bit unusual for a bugfix release; on the
- other hand, they won't be removed any time soon and inserting the
- deprecation warnings now will give everyone as much time as possible for
SciDAVis 0.2.4
add to watchlist add to download basket send us an update REPORT- runs on:
- Linux
3 screenshots:
- main category:
- Science and Engineering
- developer:
- visit homepage
Zoom Client 6.0.4.38135
The official desktop client for Zoom, the popular video conferencing and collaboration tool used by millions of people worldwide

Windows Sandbox Launcher 1.0.0
Set up the Windows Sandbox parameters to your specific requirements, with this dedicated launcher that features advanced parametrization

7-Zip 23.01 / 24.04 Beta
An intuitive application with a very good compression ratio that can help you not only create and extract archives, but also test them for errors

Microsoft Teams 24060.3102.2733.5911 Home / 1.7.00.7956 Work
Effortlessly chat, collaborate on projects, and transfer files within a business-like environment by employing this Microsoft-vetted application

ShareX 16.0.1
Capture your screen, create GIFs, and record videos through this versatile solution that includes various other amenities: an OCR scanner, image uploader, URL shortener, and much more

IrfanView 4.67
With support for a long list of plugins, this minimalistic utility helps you view images, as well as edit and convert them using a built-in batch mode

Bitdefender Antivirus Free 27.0.35.146
Feather-light and free antivirus solution from renowned developer that keeps the PC protected at all times from malware without requiring user configuration

4k Video Downloader 1.5.3.0080 Plus / 4.30.0.5655
Export your favorite YouTube videos and playlists with this intuitive, lightweight program, built to facilitate downloading clips from the popular website

calibre 7.9.0
Effortlessly keep your e-book library thoroughly organized with the help of the numerous features offered by this efficient and capable manager

Context Menu Manager 3.3.3.1
Customize Windows’ original right-click context menu using this free, portable and open-source utility meant to enhance your workflow

% discount
4k Video Downloader
- 4k Video Downloader
- calibre
- Context Menu Manager
- Zoom Client
- Windows Sandbox Launcher
- 7-Zip
- Microsoft Teams
- ShareX
- IrfanView
- Bitdefender Antivirus Free
essentials
Click to load comments
This enables Disqus, Inc. to process some of your data. Disqus privacy policy