An Open Source Qt application that can be used for data plotting and function analysis. #Data plotting #Function analysis #3D plots #LabPlot #Data #Plotting
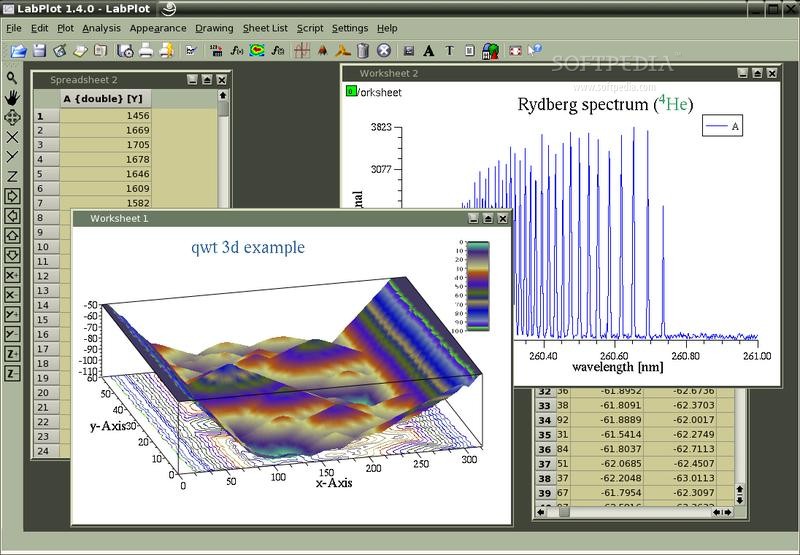
LabPlot is a free, portable and open source graphical software implemented in Qt for the KDE Plasma desktop environment and designed from the offset to be used for interactive analysis of scientific data, supporting both 3D (three dimensional) and 2D (two dimensional) plots.
Key features include support for emulating most of the functions that are supported by various plotting application, such as SPSS Sigmaplot or Microcal Origin, supports basic GRASS plots, multiple plots per worksheet, extensive parser, image reader, data set operations, and support for all GSL (GNU Scientific Library) constants and functions.
LabPlot lets users to easily edit plots in many ways, analyse functions and data like peak find, integration, histogram, regression, fourier transform, convolution, deconvolution, as well as to export worksheets in several formats, such as as PS, SVG, PDF, EPS, and many others.
Its graphical user interface (GUI) is sleek, easy to use and intuitive. It offers all the plotting functions you’ll ever need, as well as a wide range of useful functionality and configuration options that make it stand out from other similar products.
LabPlot is a not so popular software, which means that most probably it is not included in the main software repositories of your GNU/Linux distribution. To install it, you will have to download the latest version of LabPlot from Softpedia using the dedicated download section above.
Save the archive on a location of your choice, extract its contents using your favorite archive manager utility, and navigate to the location of the extracted archive files in a terminal emulator, using the ‘cd’ command (e.g. cd /home/softpedia/labplot-2.0.1).
Then, run the ‘./compile’ command to configure and compile the program. After a successful compilation process, install it system wide by running the ‘sudo make install’ command in the terminal emulator window.
What's new in LabPlot 2.0.2:
- With this release we started to implement what is usually named as “data analysis” in plotting software and we’ll add new analysis features gradually in the next releases. We hope to quickly close the gap in this area to the feature set that was available in the old (kde3-based) version of LabPlot. The first step in this direction is linear and non-linear regression analysis available now in LabPlot. Creating a fit to data is easy – given the data sets in a spreadsheet, one adds a new “xy-curve from a fit to data” to a plot and provides the data to be fitted and the mathematical model. Here, several predefined fit models are provided. User-defined models are also possible. The fit to the data is shown as the curve in the plot once the calculation is done and the goodness of the fit is documented with the help several parameters like sum of squared errors etc.
- With version 2.0.2 2D-curves defined by mathematical equations in cartesian and polar coordinates or via a parametric equation can be plotted. This is done just by adding a “xy equation curve” to the plot and by providing the mathematical expression and ranges defining that curve.
- The text field for the mathematical equation helps the user with syntax completion and highlighting. Two dialogs where all supported mathematical and physical constants and functions help further with the definition of mathematical expressions.
- In addition to the two big new features described above, many smaller features and improvements were implemented.
LabPlot 2.0.2
add to watchlist add to download basket send us an update REPORT- runs on:
- Linux
- main category:
- Science and Engineering
- developer:
- visit homepage
4k Video Downloader 1.5.3.0080 Plus / 4.30.0.5655

7-Zip 23.01 / 24.04 Beta

IrfanView 4.67

Zoom Client 6.0.3.37634

ShareX 16.0.1

Bitdefender Antivirus Free 27.0.35.146

Microsoft Teams 24060.3102.2733.5911 Home / 1.7.00.7956 Work

Windows Sandbox Launcher 1.0.0

Context Menu Manager 3.3.3.1

calibre 7.9.0

- Windows Sandbox Launcher
- Context Menu Manager
- calibre
- 4k Video Downloader
- 7-Zip
- IrfanView
- Zoom Client
- ShareX
- Bitdefender Antivirus Free
- Microsoft Teams