JProfiler For Linux
Last updated: Jan 15, 2014
Other/Proprietary License with Free Trial
An all-in-one Java profiler for Linux. #Java profiler #Java testing #Quality testing #Java #Profiler #Test
JProfiler is a commercial and cross-platform award-winning all-in-one Java profiler.
Because it is written in Java, JProfiler can be used on Linux, Mac OS X and Windows platforms.
What's new in JProfiler 8.0.3:
- New features:
- Bundled integration for IntelliJ IDEA 13 (the newest IDEA plugin is always available in time from the IDEA plugin manager)
JProfiler 8.0.3
add to watchlist add to download basket send us an update REPORT- runs on:
- Linux
- filename:
- jprofiler_linux_8_0_3.tar.gz
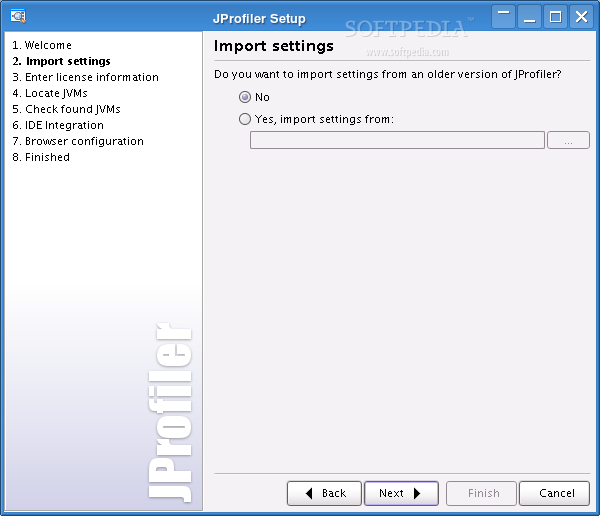
3 screenshots:
- main category:
- Programming
- developer:
- visit homepage
4k Video Downloader 1.5.3.0080 Plus / 4.30.0.5655
Export your favorite YouTube videos and playlists with this intuitive, lightweight program, built to facilitate downloading clips from the popular website

ShareX 16.0.1
Capture your screen, create GIFs, and record videos through this versatile solution that includes various other amenities: an OCR scanner, image uploader, URL shortener, and much more

calibre 7.9.0
Effortlessly keep your e-book library thoroughly organized with the help of the numerous features offered by this efficient and capable manager

7-Zip 23.01 / 24.04 Beta
An intuitive application with a very good compression ratio that can help you not only create and extract archives, but also test them for errors

IrfanView 4.67
With support for a long list of plugins, this minimalistic utility helps you view images, as well as edit and convert them using a built-in batch mode

Windows Sandbox Launcher 1.0.0
Set up the Windows Sandbox parameters to your specific requirements, with this dedicated launcher that features advanced parametrization

Bitdefender Antivirus Free 27.0.35.146
Feather-light and free antivirus solution from renowned developer that keeps the PC protected at all times from malware without requiring user configuration

Context Menu Manager 3.3.3.1
Customize Windows’ original right-click context menu using this free, portable and open-source utility meant to enhance your workflow

Microsoft Teams 24060.3102.2733.5911 Home / 1.7.00.7956 Work
Effortlessly chat, collaborate on projects, and transfer files within a business-like environment by employing this Microsoft-vetted application

Zoom Client 6.0.3.37634
The official desktop client for Zoom, the popular video conferencing and collaboration tool used by millions of people worldwide

% discount
Context Menu Manager
- Context Menu Manager
- Microsoft Teams
- Zoom Client
- 4k Video Downloader
- ShareX
- calibre
- 7-Zip
- IrfanView
- Windows Sandbox Launcher
- Bitdefender Antivirus Free
essentials
Click to load comments
This enables Disqus, Inc. to process some of your data. Disqus privacy policy