This is the original and the powerful GNU Project Debugger for Linux operating systems. #GNU debugger #GDB #Debugger
GDB (also known as GNU Project debugger) is an open source and free command-line software that allows users and developers alike to see what is going on `inside' another program, while it is executed, or why an application is crashing at a certain point.
Key features include four different techniques to help developers catch bugs in the act, start an application and specifying anything that might affect its behavior, make a program stop on specified conditions, examine the logs when the application crashed, gradually change things in a program in order to experiment with correcting the effects of one issue, and continue by learning about another bug. It also supports debugging of programs written in a wide range of programming languages, including C, C++, Pascal, Ada, Objective-C, and many others.
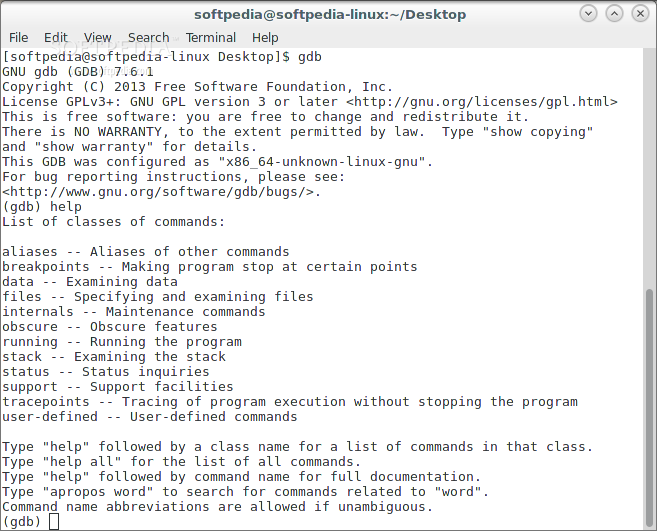
GNU Project debugger is an will always be a command-line application. To use it, you must run the “gdb” command in a terminal emulator, then execute the “help” command (without quotes) a the gdb prompt. You can also type the “help all” command to view a list of all commands, type "help" followed by command name to view the complete documentation, type "help" followed by a class name to view a list of commands in that class, to type "apropos word" to search for commands related to "word."
After typing the “help” command as described above, you will see a list of classes of commands, including aliases (displays aliases of other commands), breakpoints (makes the program to stop at certain points), data (for examining data), files (for examining files), internals (maintenance commands), obscure (obscure features), running (for running the program), stack (for examining the stack), status (for status inquiries), support (for support facilities), tracepoints (for tracing program execution without stopping the program) and user-defined (user-defined commands).
GDB has been designed from the offset to be a cross-platform application, running on mainstream operating systems like Microsoft Windows and some of the most popular Linux/UNIX variants. It is supported on both 32-bit and 64-bit hardware platforms.
What's new in GDB 8.3.1:
- This is a minor corrective release over GDB 8.3, fixing the following issues:
- PR c++/20020 (GDB segfault on printing objects)
- PR gdb/24454 (nat/x86-linux-dregs.c:146: internal-error: void x86_linux_update_debug_registers(lwp_info*): Assertion `lwp_is_stopped (lwp)' failed)
GDB 8.3.1
add to watchlist add to download basket send us an update REPORT- runs on:
- Linux
- filename:
- gdb-8.3.1.tar.gz
- main category:
- Programming
- developer:
- visit homepage
4k Video Downloader 1.5.3.0080 Plus / 4.30.0.5655

calibre 7.9.0

Context Menu Manager 3.3.3.1

7-Zip 23.01 / 24.04 Beta

Bitdefender Antivirus Free 27.0.35.146

Microsoft Teams 24060.3102.2733.5911 Home / 1.7.00.7956 Work

IrfanView 4.67

Zoom Client 6.0.3.37634

ShareX 16.0.1

Windows Sandbox Launcher 1.0.0

- Zoom Client
- ShareX
- Windows Sandbox Launcher
- 4k Video Downloader
- calibre
- Context Menu Manager
- 7-Zip
- Bitdefender Antivirus Free
- Microsoft Teams
- IrfanView