This project provides an Open Source statistical data collector, analyzer, aggregator and more.... #Data collector #Data analyzer #Data aggregator #Statistical #Data #Collector
DHIS 2 (District Health Information Software) is an open source, flexible, platform-independent and free web-based software that can be used to collect, analyze, validate and present aggregated (statistical) data. It’s a modular information system based on free and open source Java frameworks, such as Spring, Hibernate and WebWork.
The software can be used to capture data on any type of device, including laptops, desktops, tablets, smartphones and other devices. It provides a wide range of solutions based on Java, SMS and HTML5, which work offline to improve reach in locations with poor connectivity.
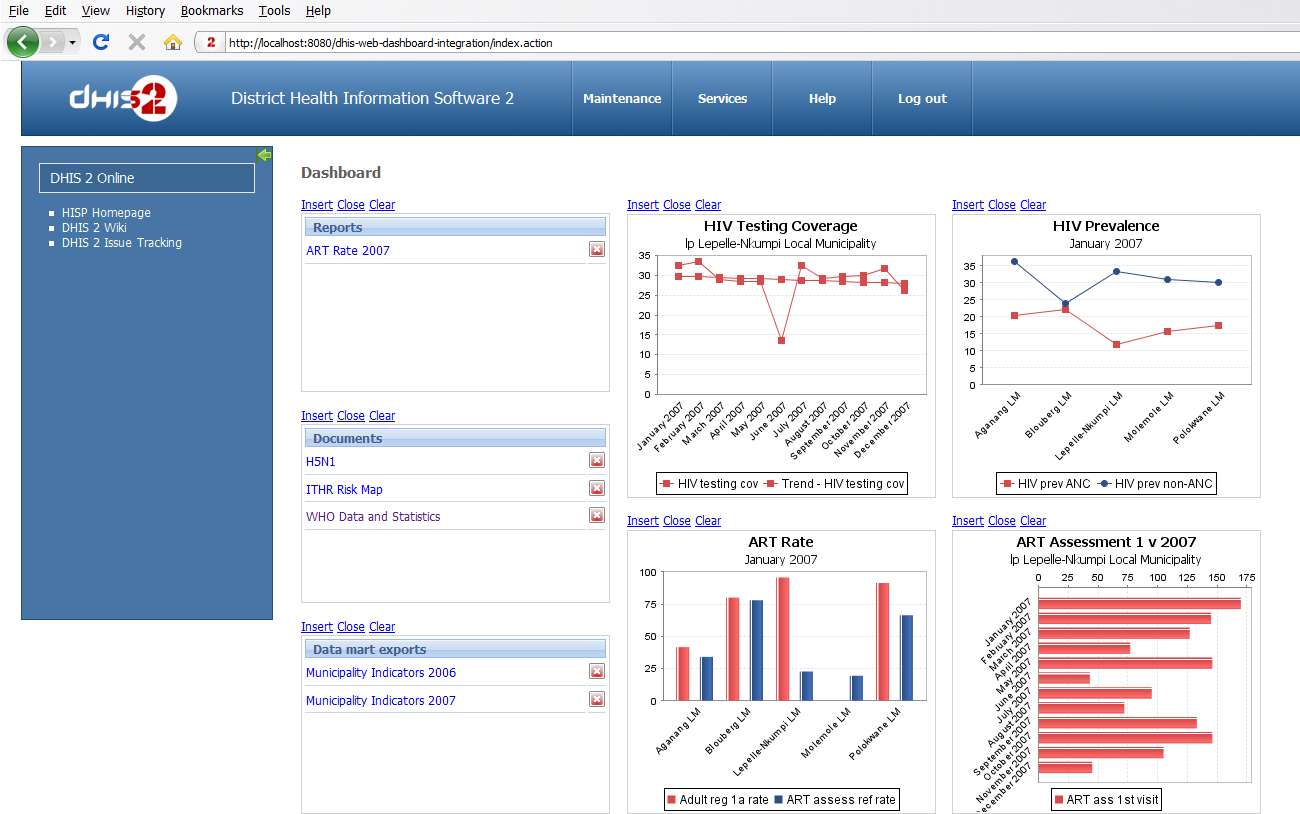
It features superb visualization features, such as Geographic Information Systems (GIS), pivot tables and charts. Offers an application for capturing and reporting events, tracks entities, access control and data approval tools, top menu system, support for OpenID authentication, user account invites and extended sharing.
DHIS 2 is dubbed by its developers as the world’s most popular free health information system, as it is being used by numerous organisations and health institutions across five continents in over 45 countries.
It is interoperable, featuring its own DXF 2 file format and SDMX-HD standard, specially designed for data exchange and metadata. A REST-based Web API will give developers instant access to most parts of the project.
Another interesting feature is the ability to be support hundreds of millions of data records and thousands of concurrent users using only a single web server. Please keep in mind that the software is heavily used as the national health information system in a wide range of countries.
The program is written entirely in the Java programming language, designed to run on the cloud, which means that it is platform-independent. All you need to use DHIS 2 is a modern web browser that supports JavaScript.
What's new in DHIS 2 2.18:
- Interactive items: The map items let you zoom in or out and drill down/float up between layers. Click on series in charts to hide or show them. Hover over maps and charts to see data values and details.
- Google maps: The map dashboard items now use Google maps as background layer.
- Re-size items: You can re-size items and switch between normal, double and full width by clicking on the "resize" link on the item headers.
- Event reports: You can now include event reports in your dashboard.
DHIS 2 2.18
add to watchlist add to download basket send us an update REPORT- runs on:
- Linux
- filename:
- dhis2-live.zip
- main category:
- Information Management
- developer:
- visit homepage
4k Video Downloader 1.5.3.0080 Plus / 4.30.0.5655

calibre 7.9.0

Zoom Client 6.0.0.37205

Windows Sandbox Launcher 1.0.0

Bitdefender Antivirus Free 27.0.35.146

ShareX 16.0.1

IrfanView 4.67

paint.net 5.0.13 (5.13.8830.42291)

Microsoft Teams 24060.3102.2733.5911 Home / 1.7.00.7956 Work

7-Zip 23.01 / 24.04 Beta

- paint.net
- Microsoft Teams
- 7-Zip
- 4k Video Downloader
- calibre
- Zoom Client
- Windows Sandbox Launcher
- Bitdefender Antivirus Free
- ShareX
- IrfanView